Childhood leukaemia
One of the ways that scientists have researched the possible risk of childhood leukaemia and overhead lines, is by using epidemiology. Epidemiology looks at statistical patterns in human populations, so in this case, it looks at whether more children are diagnosed with leukaemia when they live close to overhead lines compared to those who do not live close by. This type of study can only find associations, not causes, of diseases. To find causes we look to laboratory and mechanistic studies.
Over 40 epidemiological studies have now been performed looking at a possible link between childhood leukaemia and EMFs. Some of those studies found no association with magnetic fields, but many did find associations. Overall, there is a statistical association within the studies that have been performed between high average magnetic fields and childhood leukaemia, although that association has become weaker in recent years.
By contrast, the evidence from the laboratory, through experiments on animals and cells, is that EMFs, at the levels produced by overhead lines, do not show evidence of an increase in childhood leukaemia incidence, or any other effects. No mechanism or way that EMFs could cause childhood leukaemia has been identified. Therefore, the uncertainty is a weak statistical association only and no evidence for causation has been found.
This statistical evidence has led to magnetic fields being classed as a possible cause of cancer by the International Agency for Research on Cancer (IARC).
Summarising the epidemiological evidence
This section summarises some of the major epidemiological studies that have been published to date. The summaries start with pooled analyses. These pool the results from individual studies and calculate a single overall result, giving the results more statistical significance. These studies have been carried out over a number of years and demonstrate how the statistical association has become weaker.
These studies quantify the association by a ‘relative risk’ (RR) or an ‘odds ratio’ (OR), but what does that mean?
These terms refer to how the risks between two groups are compared, in this situation a ‘control’ group (those who live away from overhead lines) and a ‘cases’ group (those who live close to overhead lines).
The results are expressed as a ratio of the two risks. A relative risk of one means the risk is the same in both groups (no association), and a relative risk of two, for example, means the risk in the people exposed is twice that in the people not exposed. So, if your risk of naturally contracting a disease was 1 in 20 000, that risk would increase to 1 in 10 000 if the relative risk was 2. It does not mean twice as many people will contract the disease; it just reflects potential risks. There are lots of other factors to take into account when considering relative risk numbers, such as confidence intervals, which tell us how much confidence we have in the results. Each paper will show these.
Individual epidemiological studies of childhood leukaemia are best summed up in the various pooled analyses which have been carried out over the years. The first notable study was by Ahlbom in 2000, but since that study more have been carried out, the most recent in 2024.
Below is a summary of the results from some of the more notable studies and how the results have changed over time.
If on a phone the table is best viewed in landscape.
| Study | Date | What did they find? | Relative risk or odds ratio |
|---|---|---|---|
|
Ahlbom et al |
2000 |
Statistically, there was little or no suggestion of an increased risk at the levels of magnetic fields to which the overwhelming majority of children are exposed. The study did, however, find that in the category of homes with a field, averaged over 24 hours, of greater than 0.4 microteslas (which affects fewer than half a percent of children in the UK) there is a statistical suggestion of increased risk. Some of these homes are near power lines, but many are not and result from distribution cabling and household wiring. They concluded: “The explanation for the elevated risk is unknown, but selection bias may have accounted for some of the increase.” |
RR = 2.00 for residential exposures greater than 0.4 μT |
|
Kheifets et al. |
2010 | A new pooled analysis looked at more recent studies. It concluded that the studies since 2000 broadly confirm the Ahlbom finding but suggests the association has become slightly weaker. | OR = 1.44 for residential exposures greater than 0.3 μT |
|
Amoon et al. |
2018 |
This study, rather than looking at magnetic field exposure, focused on proximity to overhead lines as a proxy for exposure. Their conclusions were: “In this first comprehensive pooled analysis of childhood leukaemia and distance to power lines, we found a small and imprecise risk for residences < 50 m of 200 + kV lines that was not explained by high magnetic fields. Reasons for the increased risk, found in this and many other studies, remains to be elucidated.” |
OR = 1.33 with 50m of overhead line |
|
Amoon et al. |
2022 |
This pooled analysis was an update to that performed in 2010 by Kheifets et al. It looked at both magnetic field strength and proximity to overhead lines. Their conclusions were: “Our results are not in line with previous pooled analysis and show a decrease in effect to no association between MF and childhood leukemia. This could be due to methodological issues, random chance, or a true finding of disappearing effect.” |
OR = 1.01, for exposure greater than 0.4 μT |
Some of the recently published studies have reported lower risks since the Ahlbom pooled analysis. This was tested in a paper published in 2017. This drew on all the individual studies (42 in total) from 1979 to 2018. It calculated the best estimate of the overall risk using just the studies published up to each successive year.
The main finding of the paper reported that risk has decreased. In the 1990s, the best estimate of relative risk was just over 2; now it is closer to 1.5. But the risk is still elevated and still statistically significant. This excludes studies that have been published since 2018, but the pooled analysis published in 2022 suggests a further decline to ‘no association’.
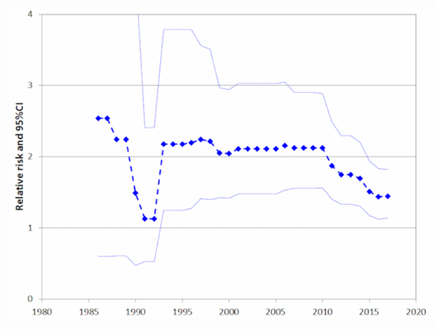
The graph above shows the relative risk of Childhood Leukaemia decreasing with time (Swanson et al 2019).
The most notable study on childhood leukaemia and proximity to overhead lines carried out in the UK was by the Childhood Cancer Research Group (CCRG) at the University of Oxford. This study published several papers between 2005 and 2016. They looked at factors including:
- Proximity to overhead lines
- Magnetic field exposure
- Paternal occupation
- Changes in risk over time
- Corona ion theory
- Underground cable exposures
Distance from overhead lines
This paper was published in the British Medical Journal on 3 June 2005 and gave results for distance from 275 kV and 400 kV overhead lines in England and Wales. It did not just focus on childhood leukaemia but considered all childhood cancers.
In summary, it concluded:
- Children who were born within 200 m of high-voltage power lines had a relative risk of leukaemia of 1.69, which was statistically significant.
- Those born in homes between 200 m and 600 m had a relative risk of 1.23, which was statistically significant.
- The results had a trend of decreasing risk as the birth address got further from the overhead line.
- No excess risk in relation to proximity to lines was found for other childhood cancers.
- The results do not seem to be compatible with the existing data on magnetic fields and cancer because they extend too far from the line. This was explored more fully in the subsequent magnetic-fields paper.
- There is no evidence the results are explained by the “corona ion” hypothesis.
Magnetic field exposure
This paper, published in the British Journal of Cancer in 2010, looks at exactly the same subjects (and overhead lines) as the "distance" paper, but as well as calculating the distance from the overhead line, it also calculates the magnetic field.
For childhood leukaemia, they found a relative risk of 2 for homes with magnetic fields greater than 0.4 µT when compared to homes with magnetic fields less than 0.1 µT, which was not statistically significant because of the confidence intervals but consistent with previous studies.
Magnetic fields greater than 0.4 µT are usually only found within 50 m or so of these overhead lines. Therefore, magnetic fields seem extremely unlikely to explain the previous "distance" findings, where the elevation in risk extended to at least 600 m.
Parental exposure
A 2012 paper looked at the father's occupation, as recorded on the birth certificate, and the subsequent risk of the child developing leukaemia. Among various findings relating to social class, social contacts, etc, there was a raised risk in the "other" group of leukaemias (that is, not lymphoid or acute myeloid) for occupations deemed to involve EMF exposure. The authors suggest this could be a chance finding, as they looked at 33 exposure groups and you would expect some of those to be positive and some negative by chance alone.
Changes in risk over time
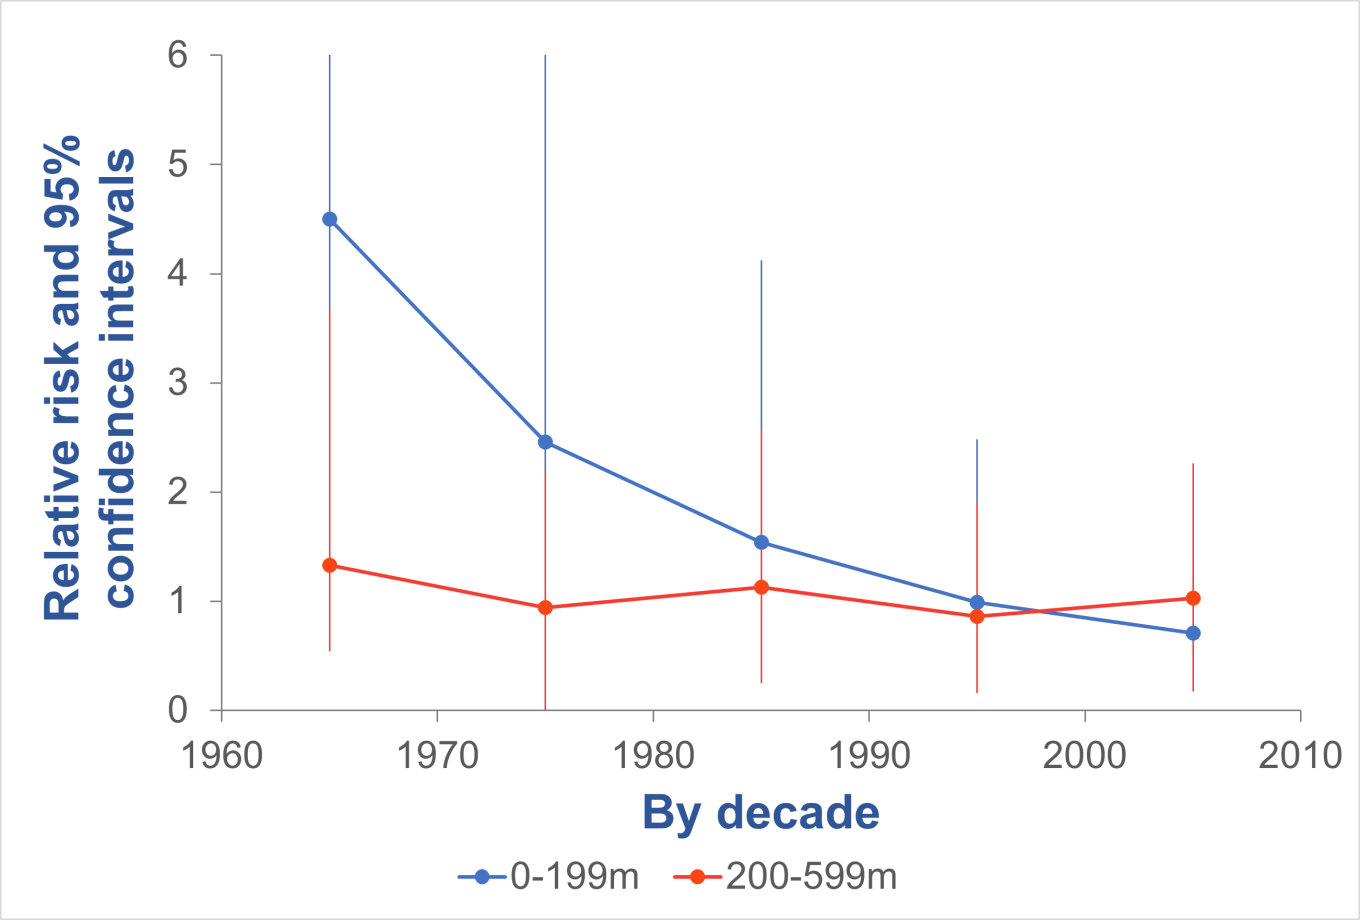
This paper was a follow on to the 2005 CCRG paper and included additional data for childhood leukaemia cases between 1998 – 2008, Scottish data, and 132 kV overhead lines. They also looked at how the results changed over the decades. The summary of the results is:
- As with the original paper, there are no clear patterns of results for brain tumours or for "other cancers". All the following discussion relates to childhood leukaemia.
- 132 kV lines seemed to show similar results to the 275 kV and 400 kV lines, but there is generally a smaller effect, and it is confined to smaller distances.
- Scotland produced results consistent with England and Wales, but because the number of cases in Scotland is much smaller, the results from Scotland on their own are not statistically significant.
- The original elevated risks for childhood leukaemia extended to 600 m, the furthest distance tested, which raised the question of whether there would have been an elevation beyond that had the study looked. This follow-on study finds no elevations between 600 m and 1000 m, suggesting that the original 600 m was in fact the outer limit.
When the results are looked at by decade, the risk for childhood leukaemia seems to have diminished over time, as summarised here. The authors concluded:
“A risk declining over time is unlikely to arise from any physical effect of the powerlines and is more likely to be the result of changing population characteristics among those living near powerlines.”
Corona ion theory
In October 2014 CCRG published a paper looking at whether their results could be explained by the "corona ion hypothesis". This theory suggests:
- The air ions produced on the surface of the conductors of high-voltage power lines are blown away by the wind.
- They then attach to existing airborne pollutants making those pollutants more charged.
- This in turn makes the pollutants more likely to be retained in the airways when breathed in and increase any health effects they already cause.
CCRG modelled this effect, using actual meteorological data to look at the wind directions, and concluded:
“Thus, we conclude that the simple corona-ion hypothesis that we test here explains the observed pattern of leukaemia rates around power lines less well than straightforward distance. Our findings therefore do not support this corona-ion hypothesis as the explanation of these results.”
Underground cables
In 2015 the CCRG published a paper on underground cables. The point of this is that underground cables produce magnetic fields, but (unlike overhead lines) nothing else about the magnetic fields are different except they are not visually prominent, so if there was an association with underground cables, it would almost certainly have to be caused by magnetic fields.
In fact, the study did not find associations:
“We have, in fact, overall found no evidence of increased risks for leukaemia. Despite the tiny fraction of people living close to UGCs, which severely limits the statistical power, the large overall size of this study means that this finding still carries some weight ..... We conclude that these results are modest, though far from conclusive, evidence against MFs being a cause of leukaemia, and therefore, indirectly, provide some further suggestive evidence that where risk elevations are found near OHLs, they may be caused by factors other than MFs.”
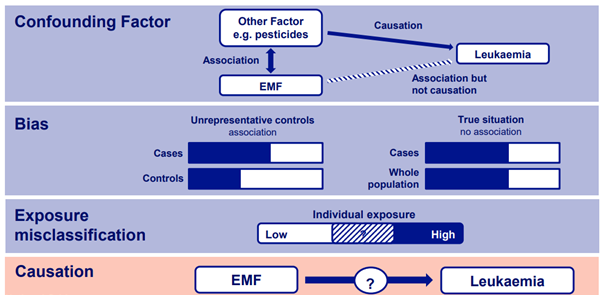
There has been a persistent statistical association between high average magnetic fields and childhood leukaemia within the studies that have been performed, although that association has become weaker in recent years. No one knows why this association exists, but several explanations been suggested.
- Confounding factors: These are some other factors co-located by chance with overhead lines that may be causing the association other than magnetic fields. One confounder investigated recently was pesticides. In the USA, overhead lines are often co-located with plant nurseries, and it was hypothesised that this may be an explanation of the associations found, which has yet to be confirmed. Another potential confounder could be socio-economic status, the types of houses close to lines, or some other factor not yet known.
- Bias: The commonest type of bias is when some people choose to participate in the studies but others decline. If more people with higher socioeconomic status – who tend to be exposed to lower fields – agree to participate, and this happens more in the “control” children than in the cases, this can create a bias. One study investigating bias and confounders was the TransExpo study, published in 2024 which is discussed further down this page.
- Exposure mis-classification: Assessing an individual’s magnetic field exposure in an epidemiological study can be very difficult. Assumptions are made assuming that the overhead line is the exposure source. However, people are exposed to magnetic fields from a range of sources. A study by the Health Protection Agency found that around 50% of homes with magnetic field exposures above 0.4 µT were cause by high voltage overhead lines. The other 50% were mainly due to the local distribution network supplying homes. Therefore, it is difficult to assess those in high and low exposure groups.
- Chance: The results may be completely down to chance, but given the consistency, this is unlikely.
- Causation: Magnetic fields may actually be causing the elevated risk observed in the epidemiology. This cannot be ruled out, however, the laboratory studies to date, of which there are thousands, do not support this.
This study, published in 2024, was a novel design minimising the potential for selection bias. It focused on children in apartment blocks with built in transformer rooms. Children in apartments close to the transformers would have a higher exposure to magnetic fields compared to other apartments within the same block. This method sought to eliminate selection bias and socioeconomic issues.
The study was carried out in a number of countries in an attempt to increase the number of subjects therefore increasing the statistical significance. However, despite these efforts the number of individuals in the study was low, which means it is difficult to draw any meaningful conclusions.
The authors concluded:
“Overall, this study did not find consistent evidence of an elevated risk, but due to small numbers and wide confidence intervals, a risk of the magnitude observed in power lines studies cannot be excluded.”