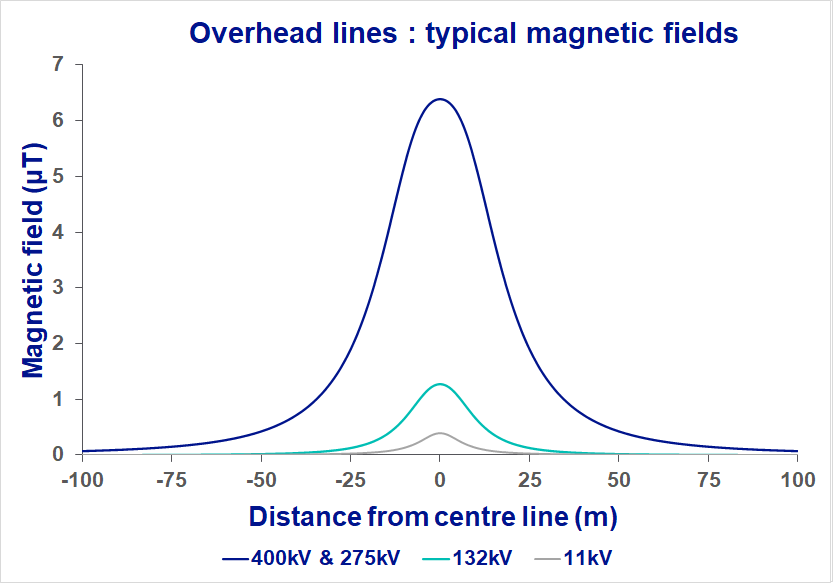
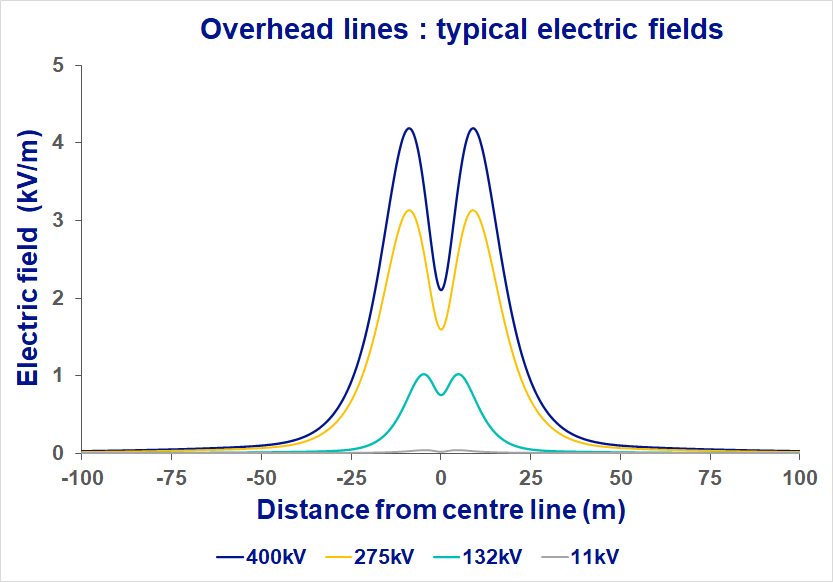
Electricity is carried round the country on overhead lines at various voltages. All overhead lines produce electric and magnetic fields. The field is highest directly under the line and falls to the sides.
This graph shows typical magnetic fields. See also similar graphs for electric fields and for maximum fields
Typical ground-level UK field levels from overhead power lines
Magnetic Field (microteslas) | Electric Field (volts per metre) | ||
---|---|---|---|
The largest steel pylons (275 kV and 400 kV) | Maximum field (under line) Typical field (under line) Typical field (25 m to side) | 100 5-10 1-2 | 11,000 3000-5000 200-500 |
Smaller steel pylons (132 kV) | Maximum field (under line) Typical field (under line) Typical field (25 m to side) | 40 0.5 – 2 0.05-0.2 | 4,000 1000-2000 100-200 |
Wooden poles (11 kV and 33 kV) | Maximum field (under line) Typical field (under line) Typical field (25 m to side) | 7 0.2-0.5 0.01-0.05 | 700 200 10-20 |
See more data on fields at various distances and the distance for the field to fall to various values.
Transmission and distribution - which is which?
What is a transmission line?

more detail on what a transmission line looks like and what its parts are.
more detail on the fields they produce.
drawings of the actual field lines produced by transmission lines
What is a distribution line?
Distribution lines are at lower voltages than transmission and are used by Distribution Network Operators for distributing electricity round an area. Some are still on steel pylons but many are wood poles.
How do overhead lines produce fields?
The magnetic field produced by a current in a conductor falls with distance from the conductor. Where there is more than one current forming part of one or more electrical circuits, there is also partial cancellation between the magnetic fields produced by the individual currents, and that cancellation generally becomes better at greater distances. Overall, the magnetic field is highest at the point of closest approach to the conductors and falls quite rapidly with distance. Similarly, there is partial cancellation between the electric fields produced by the voltages on individual conductors, and the electric field is usually highest at the point of closest approach to the conductors and falls quite rapidly with distance.
Therefore overhead lines produce a magnetic field which peaks underneath the conductors and falls rapidly with distance either side.
More detail on how fields fall with distance
More detail on the direction of the field
More detail on the factors that affect the field a line produces
How many overhead lines are there in the UK?
The following are 2011 figures:
Transmission and Distribution System Information |
|||||||
System Voltage |
Overhead Lines (km) |
Underground Cables (km) |
Transformers (No. of) |
||||
Transmission |
|||||||
400kV |
11,643 |
195 |
363 |
||||
275kV |
5,766 |
498 |
441 |
||||
132kV |
5,254 |
216 |
290 |
||||
DC link |
327 |
NA |
|||||
Distribution |
|||||||
System Voltage |
Overhead Lines (km) |
Underground Cables (km) |
Transformers (No. of) |
||||
132kV Tower |
14,697 |
3,191 |
2,588 |
1,946 |
|||
132kV Pole |
1,774 |
||||||
33kV Tower |
2,563 |
90,991 |
39,308 |
13,262 |
|||
33kV Pole |
26,557 |
||||||
20kV |
5,094 |
1,659 |
9,496 |
8,986 |
|||
11kV and 6.6kV |
163,868 |
152,224 |
567,399 |
579,944 |
|||
LV |
64,874 |
311,237 |
1,112,000 |
source: Data extracted from ENA Adaptation to Climate Change First Round Report under the ARP, Electricity Transmission and Distribution Network Companies, 23 April 2011
How many people live near high-voltage power lines?
Although people living near high-voltage power lines are a group whose exposure is high and can often be calculated reasonably well, they are a small group. In the UK, 0.07% of homes are within 50 m of transmission lines and 0.21% within 100 m. Percentages in other countries seem to be comparable (USA 1.1% within 40 m; Denmark 0.43% within 75 m), with higher percentages partly reflecting a broader definition of “transmission”. More detail on numbers of homes near power lines
Averaged over the population, high-voltage power lines contribute only a small fraction of collective average exposure to EMFs, because so few people are exposed to them. The best estimate possible from the UK is that high-voltage power lines contribute 5% of total average population exposure.
More detail on fields from power lines
- comparisons of fields from lines of different voltage: electric, magnetic, typical and maximum
- distance for the field to fall to specific values
- all the different specific lines at different voltages in use in the UK and the fields they produce
- factors which affect the field from a power line
- the physics of the fields - the field lines, the direction of the field, and how it falls with distance
Calculating the field from a power line
Magnetic fields can be calculated with considerable accuracy if the currents are known.
More detail on calculations including a direct comparison of calculations and measurements.
Raw data
In the spirit of openness, most of the raw data used to plot the graphs of fields from overhead lines on this site are available as downloadable spreadsheets.