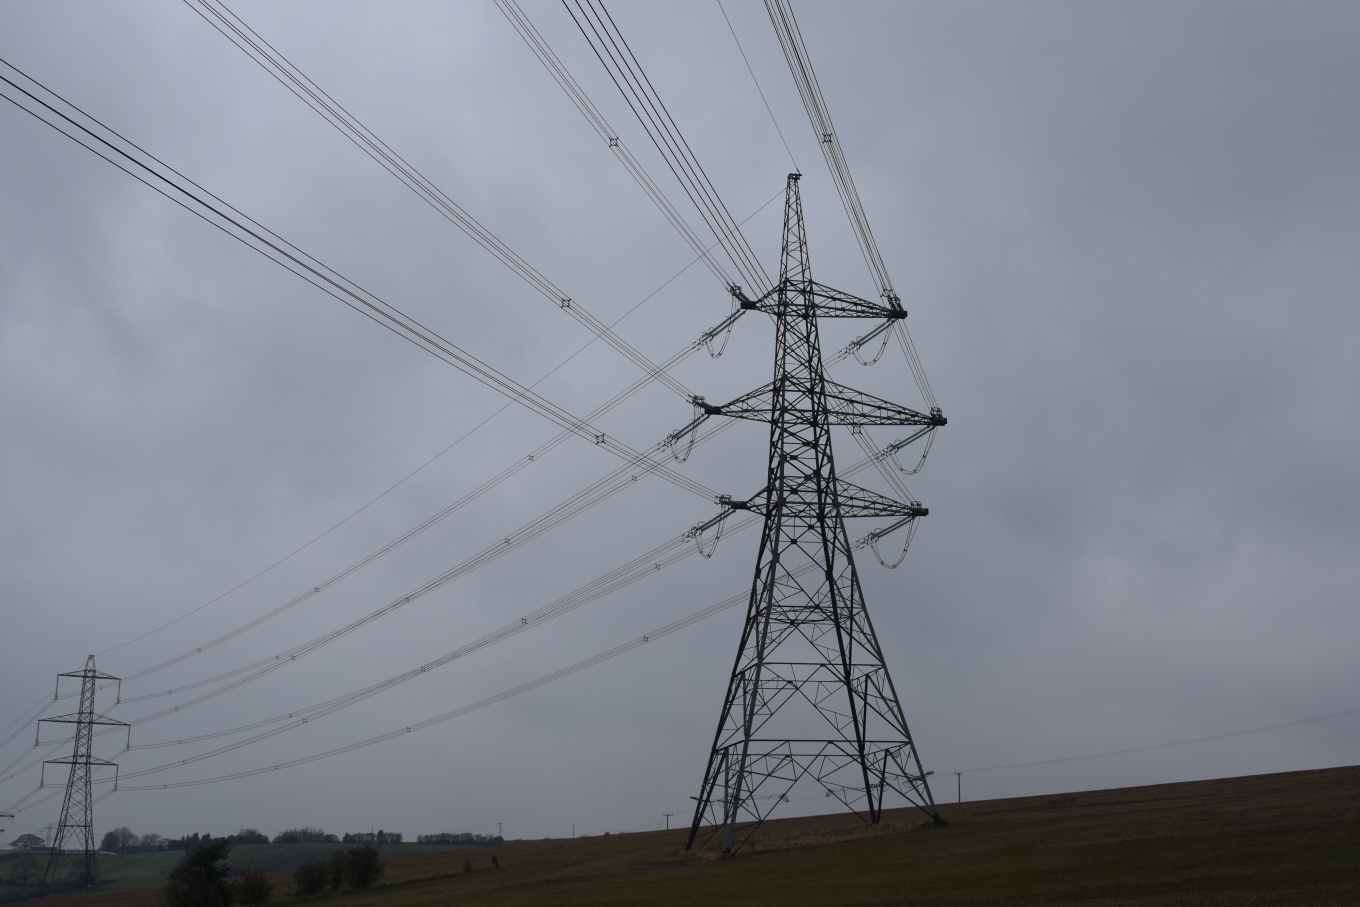
Transmission overhead lines
The largest types of overhead lines used in the UK operate at 400 kV and 275 kV. This website refers to 400 kV and 275 kV lines as transmission voltage, but in Scotland transmission voltage also includes 132 kV lines. The details on 132 kV lines are given on the distribution voltage lines page.
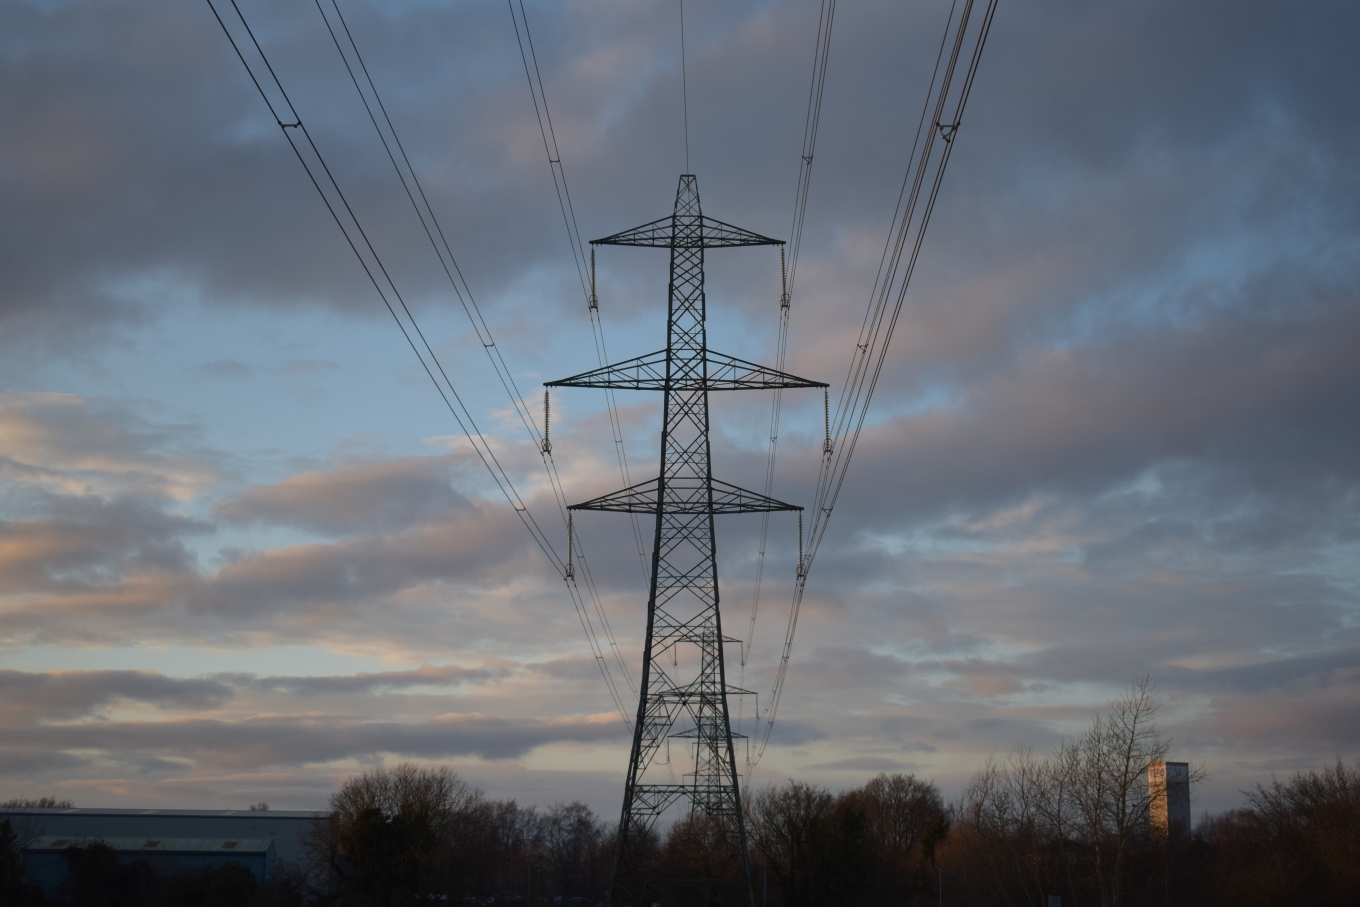
If you live or are buying a home near to one of these types of overhead lines, below are examples of the electric and magnetic fields they produce.
As explained on the ‘What are EMFs’ page, the voltage of an overhead line is fixed, so the electric field is nearly always constant. Magnetic fields are different; they can increase or decrease depending on the current the overhead line is carrying at any time. Because of this, we provide the typical levels of magnetic field that you would expect to measure from these types of overhead lines on any given day. We also provide the maximum magnetic field that each overhead line could produce if it was carrying its maximum current, however, these levels of magnetic field rarely, if ever, occur.
To help identify what voltage an overhead line is operating at, please see the ‘What is near me?’ page. Once you have identified the voltage, the graphs below will give the typical day-to-day EMF exposures that an overhead line produces.
The same pylon designs are used for 275 kV and 400 kV lines and they can carry the same current, so they produce the same magnetic fields. As electric fields are produced by the voltage, the 275 kV lines produce lower electric fields than the 400 kV lines.
The magnetic field produced by an overhead line is predominantly a result of the current or load that is flowing through the line. There are several different designs of pylon that are used for 400 kV overhead lines, and each will affect the fields that a line produces. The values given here are for typical overhead lines.
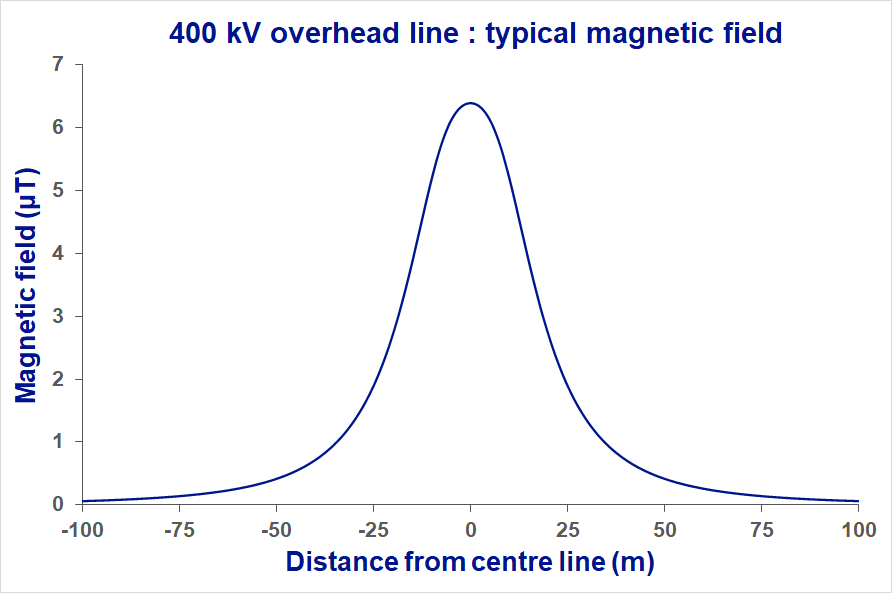
Magnetic field
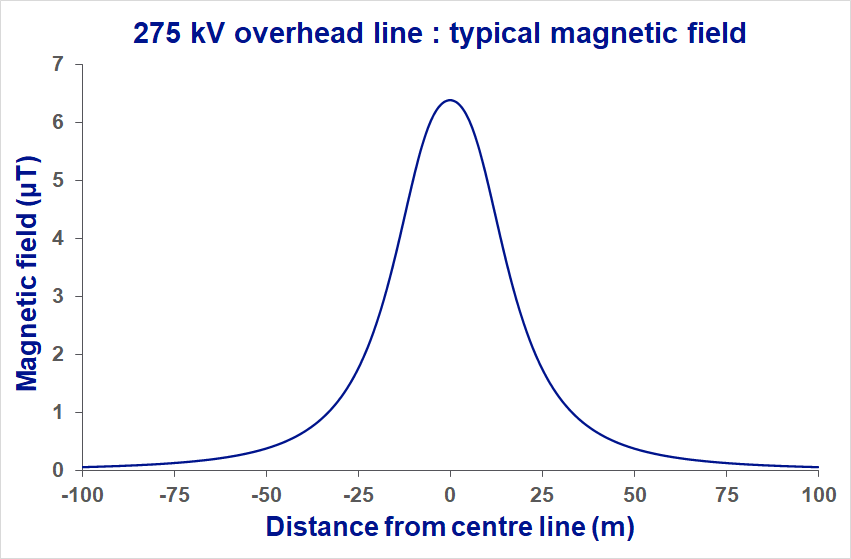
This is the typical magnetic field that a 400 kV line produces. The field is highest in the centre of the line, between the wires, and reduces the further away from the line that you get. The highest field is usually between 5 and 10 microteslas.
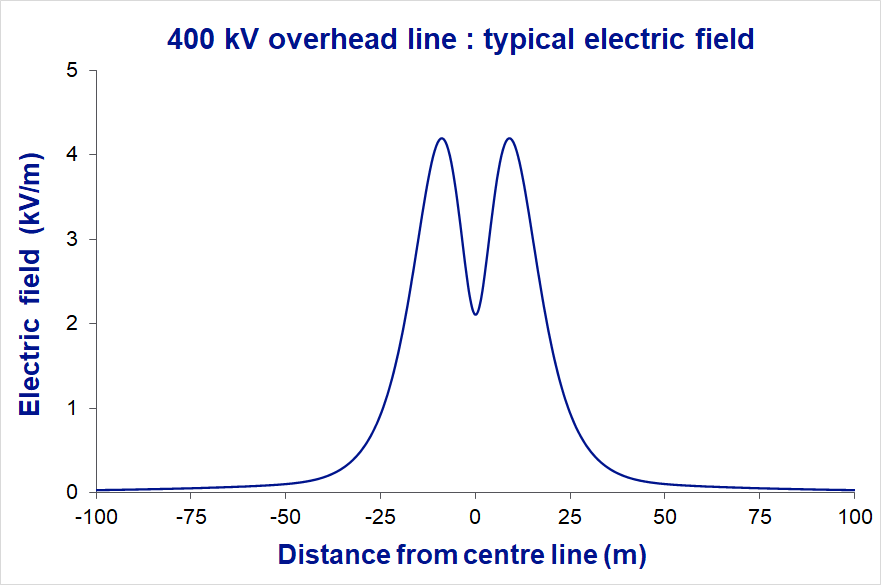
Electric field
This is the typical electric field produced by a 400 kV overhead line. The electric field is produced by the voltage, which is constant, but other factors such as how far above ground the wires are will influence the electric field from any particular line.
Typical fields from a 400 kV overhead line
| 400 kV | Directly under line | 50 m from centre line | 100 m from centre line |
|---|---|---|---|
| Magnetic field | 6.4 µT | 0.4 µT | 0.1 µT |
| Electric field | 4.2 kV/m | 0.1 kV/m | 0.0 kV/m |
Both 275 kV and 400 kV lines can carry the same current and use the same types of pylons, so they can produce the same level of magnetic field. The electric field is produced by the voltage, so 275 kV lines produce lower electric fields than 400 kV lines.
Magnetic field
This is the typical magnetic field that a 275 kV line produces. The fields are highest in the centre of the line, between the wires, and reduces the further away from the line that you get. The highest field is usually between 5 and 10 microteslas.
Electric field
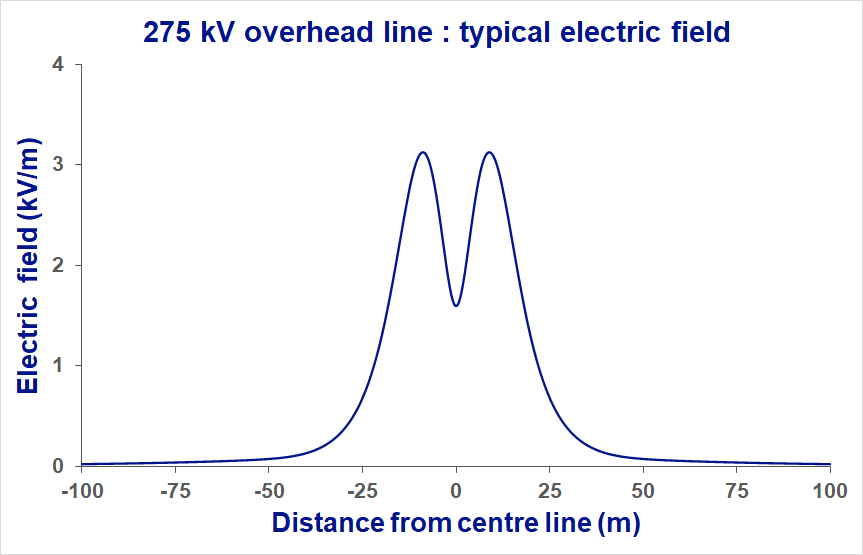
This is the typical electric field produced by a 275 kV overhead line. As this is a lower voltage than the 400 kV lines, the electric field is lower. The electric field is produced by the voltage, which is constant, but other factors such as how far above ground the wires are will influence the electric field from any particular line.
Typical fields from a 275 kV line
| 275 kV | Directly under line | 50 m from centre line | 100 m from centre line |
|---|---|---|---|
| Magnetic field | 6.4 µT | 0.4 µT | 0.1 µT |
| Electric field | 3.1 kV/m | 0.1 kV/m | 0.0 kV/m |
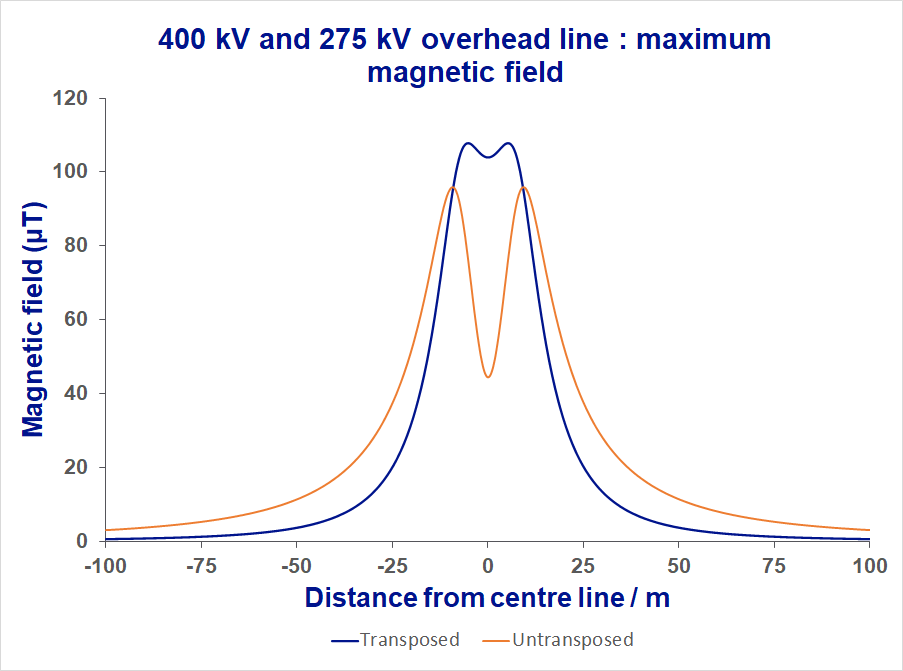
The graphs and detail above give the levels of magnetic field exposure you would expect from overhead lines during normal operating conditions. However, the lines have the capacity to carry more current, for example, when another overhead line is out of service. There is also additional headroom to account for faults that might occur at the same time. The graphs and tables below show that even if the overhead line was operating at maximum current, the magnetic fields would still be compliant with the public exposure limits.
The phasing of an overhead line is important when looking at the maximum magnetic fields that it can produce. Typical 400 kV and 275 kV lines use transposed phasing which will reduce the magnetic field at distance but can increase the field directly underneath the line. An explanation on phases and phasing can be found in the terminology and units page.
Maximum magnetic field from 400 kV and 275 kV lines
| Maximum under line | 50 m from centre line | 100 m from centre line | |
|---|---|---|---|
| 400 kV and 275 kV lines | 108 µT | 12 µT | 3 µT |
| Magnetic field public exposure limit |
360 µT |
||