SAGE
SAGE was a UK Stakeholder Advisory Group of Experts on Extremely Low Frequency EMFs, providing advice to the Government.
The aim of the process was: “To bring together the range of stakeholders to identify and explore the implications for a precautionary approach to ELF EMF (electric and magnetic fields) and make practical recommendations for precautionary measures.”
SAGE’s advice fed into the Government’s decisions on policy relating to EMFs and health. SAGE did not issue any guideline limits and any reference to SAGE Limits is incorrect.
SAGE carried out two assessments:
- The first interim assessment was published in April 2007 and considered a number of generic issues, and possible precautionary measures for EMFs from three different sources: house wiring, appliances, and power lines.
- The second interim assessment was published in 2010 covering low voltage distribution networks.
SAGE looked at the existing scientific evidence summarised by two views:
- The “World Health Organisation” view that there is a possible link between magnetic fields and childhood leukaemia.
- The “California” view that there is a possible link between magnetic fields and a range of adverse health effects.
In light of that evidence, SAGE looked at ways to reduce an individual’s exposure to electric and magnetic fields to as low as reasonably achievable. A cost benefit analysis approach was used to determine what was reasonable.
SAGE’s recommendations on power lines and property
SAGE made two recommendations:
- Electricity companies should choose optimal phasing for all new lines and convert existing lines where possible and justifiable.
- More information should be provided for households.
Both recommendations were adopted by Government and form part of the UK policy on EMFs. The policy on optimal phasing is set out in a Code of Practice issued by Government.
SAGE also analysed an option of introducing "corridors" around power lines. The corridors would restrict building residential properties and schools near existing overhead lines and restrict building new overhead lines close to existing buildings. SAGE did not recommend this to Government.
The Government’s conclusions on corridors reflected that “SAGE's cost benefit analysis does not support the option of creating corridors around power lines on health grounds. The Government therefore considers this additional option to be disproportionate in the light of the evidence base on the potential health risks arising from exposure to ELF/EMF and has no plans to take forward this action."
SAGE’s recommendations on house wiring and appliances
SAGE recommended a package of changes to house wiring practices, from using radial circuits instead of ring mains, to phasing out rotating disc meters.
Where Government policies already existed, such as the roll out of smart meters to replace rotating disc meters, these measures were welcomed. Other recommendations were not taken forward or pushed to industry to consider, such as reducing exposure from appliances.
SAGE considered numerous different precautionary measures which could be introduced to low voltage distributions systems. Where recommendations were made, each had a category assigned to it, which were:
- “Should do”, which incorporated:
- Measures that SAGE felt were appropriate to introduce.
- Best practices already used by the industry.
- “Could do”, which incorporated:
- Measures where some investigation was needed before deciding to implement.
- Measures that could be adopted where the consumer would bear the costs.
- “Don’t do”, which incorporated:
- Measures which were deemed not effective, disproportionate in terms of cost and benefit, or those which had adverse safety consequences.
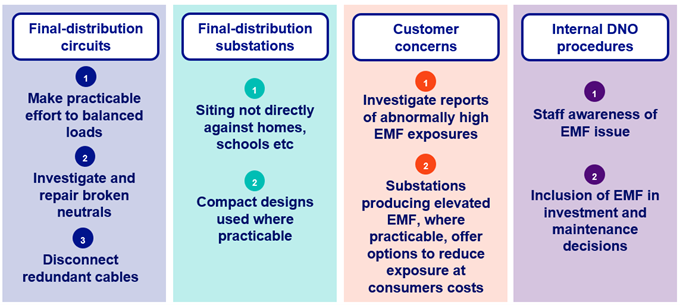
It grouped the options by the different parts of the low voltage distribution system, each with its own recommendations. These recommendations were the ‘should and could do’ measures recommended in the report:
The Government responded to these recommendations in October 2011, endorsing and implementing them through the Energy Networks Association’s Engineering Recommendation G92.